Has the Cost of Living Really Increased That Much Since 2020?In recent years, I have frequently heard claims that the cost of living in the United States has increased substantially since 2020. One claim that drew my attention stated that prices had risen by approximately 25 percent during that period. Initially, this figure appeared plausible because groceries, housing, gasoline, and other essential expenses seem more expensive than they were several years ago. However, personal experience alone cannot establish the accuracy of a statistic. Rather than accepting the claim based on its apparent plausibility, I applied the SIFT method and used lateral reading to assess whether the available evidence supported it.
Step 1: Stop
The first step in SIFT is Stop. Before looking for information that might confirm my existing beliefs, I considered precisely what the claim meant. The phrase “cost of living” stood out as a potential warning sign because it is broad: people have different expenses and buy different products. For example, price changes may affect a renter differently from a homeowner.
I therefore needed a consistent measure instead of relying on individual experiences. I decided to investigate whether overall consumer prices had increased by approximately 25% since 2020.
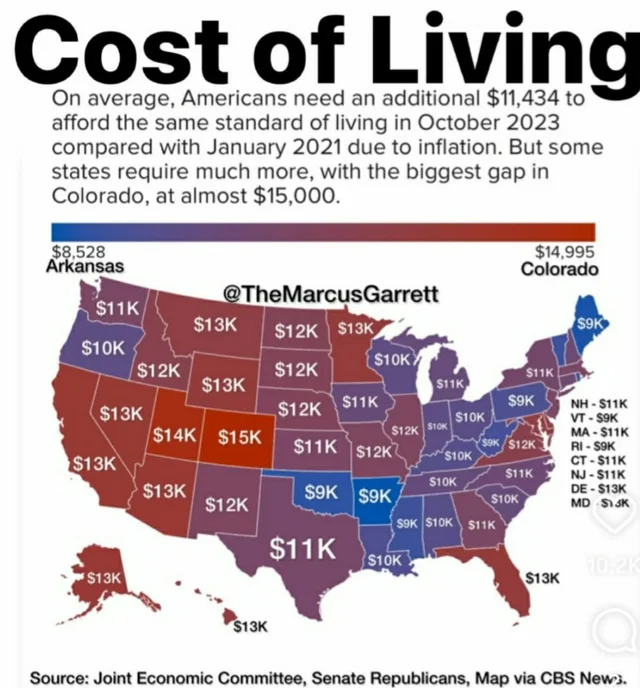
Screenshot 1: Cost of Living across the United States of America
Step 2: Investigate the Source
Instead of relying on social media posts, news commentary, or someone’s personal experience, I looked for an organization responsible for collecting U.S. price data. This led me to the U.S. Bureau of Labor Statistics Consumer Price Index.
The Bureau of Labor Statistics (BLS) defines the Consumer Price Index (CPI) as a measure of the average change over time in the prices urban consumers pay for a market basket of goods and services. As a result, the BLS provided a more authoritative basis for evaluating the claim than another website that merely repeated it.
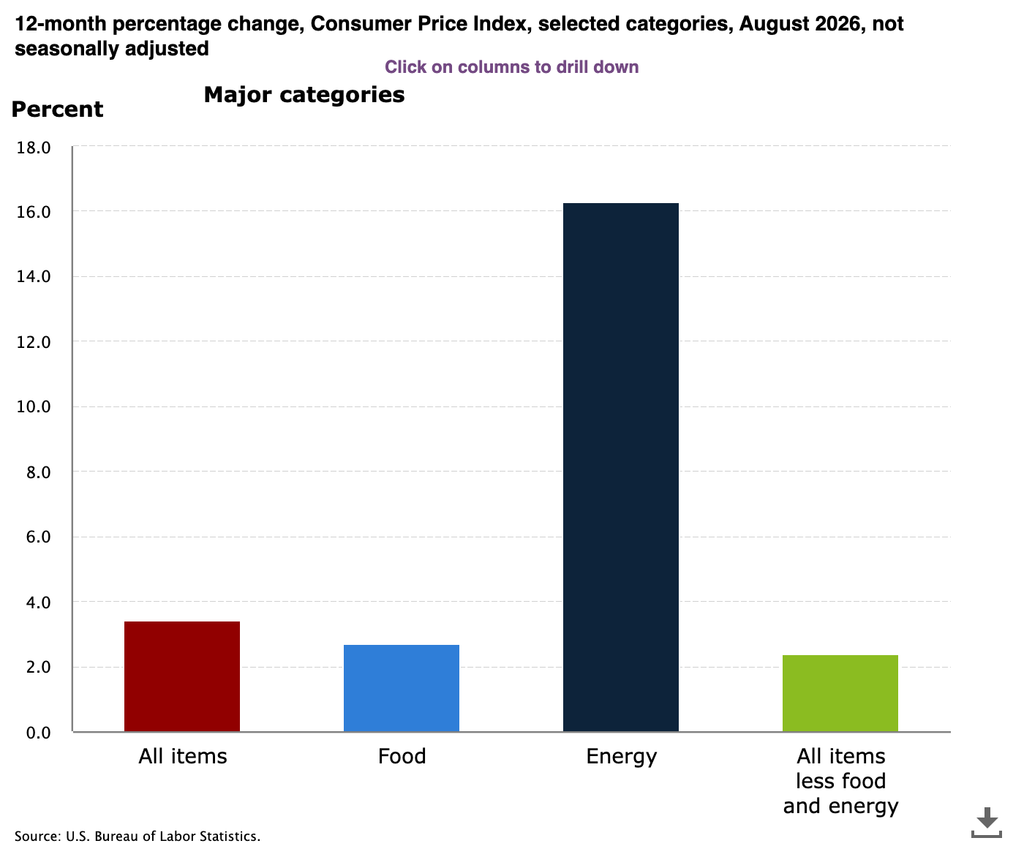
Screenshot 2: Annual Consumer Price Index
Step 3: Find Better Coverage
Next, I looked at the actual historical numbers. According to the BLS January 2020 CPI report, the CPI-U for all items was 257.971 in January 2020. Comparing this historical figure with the current CPI level indicates that overall consumer prices are approximately 30% higher than they were at the beginning of 2020. Accordingly, the claim that prices increased by approximately 25% is directionally accurate but understates the cumulative increase.
Calculation example: (current CPI − 257.971) ÷ 257.971 × 100
This comparison is more useful than examining one item because inflation affects categories such as food, housing, transportation, and energy differently. The overall CPI offers a standardized view while allowing analysis of individual categories.
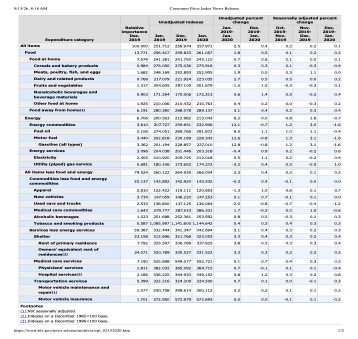
Screenshot 3: BLS January 2020 table showing 257.971 for “All items.”
Step 4: Trace the Claim to the Original Data
The final step was to consult primary sources rather than rely on articles that interpreted government statistics. Reviewing the BLS data directly made it possible to examine the underlying CPI figures and understand what the measure represents.
I also checked food prices separately through the USDA Economic Research Service Food Price Outlook. This provides another example of why a broad statement about the “cost of living” needs context. Grocery prices may change at a different rate from the overall CPI, and a household that spends a larger share of its income on food may feel inflation differently from the national average.
Screenshot 4: USDA Food Price Outlook showing the latest food-price information.
Final Assessment
After using SIFT and lateral reading, I would describe the claim that prices have risen “about 25% since 2020” as directionally accurate but understated. Comparing the CPI at the start of 2020 with current levels indicates that overall consumer prices have increased by closer to 30%. However, it would also be misleading to suggest that everyone’s cost of living has risen by exactly the same amount. The CPI tracks price changes across a broad basket of goods and services, whereas an individual’s expenses vary based on factors such as location, housing situation, purchasing habits, and spending patterns.
This exercise showed why believable claims still require verification. Before sharing economic or inflation statistics, check their source, consult reliable coverage, and trace the figures to primary data, since reasonable-sounding claims may lack important context.
Sources / Pages for Screenshots
U.S. Bureau of Labor Statistics – Consumer Price Index